Gaussian Distribution
A symmetric bell-shaped curve where data clusters around a central mean, defined by the mean and standard deviation. It is the statistical model for many natural phenomena and measurement errors.
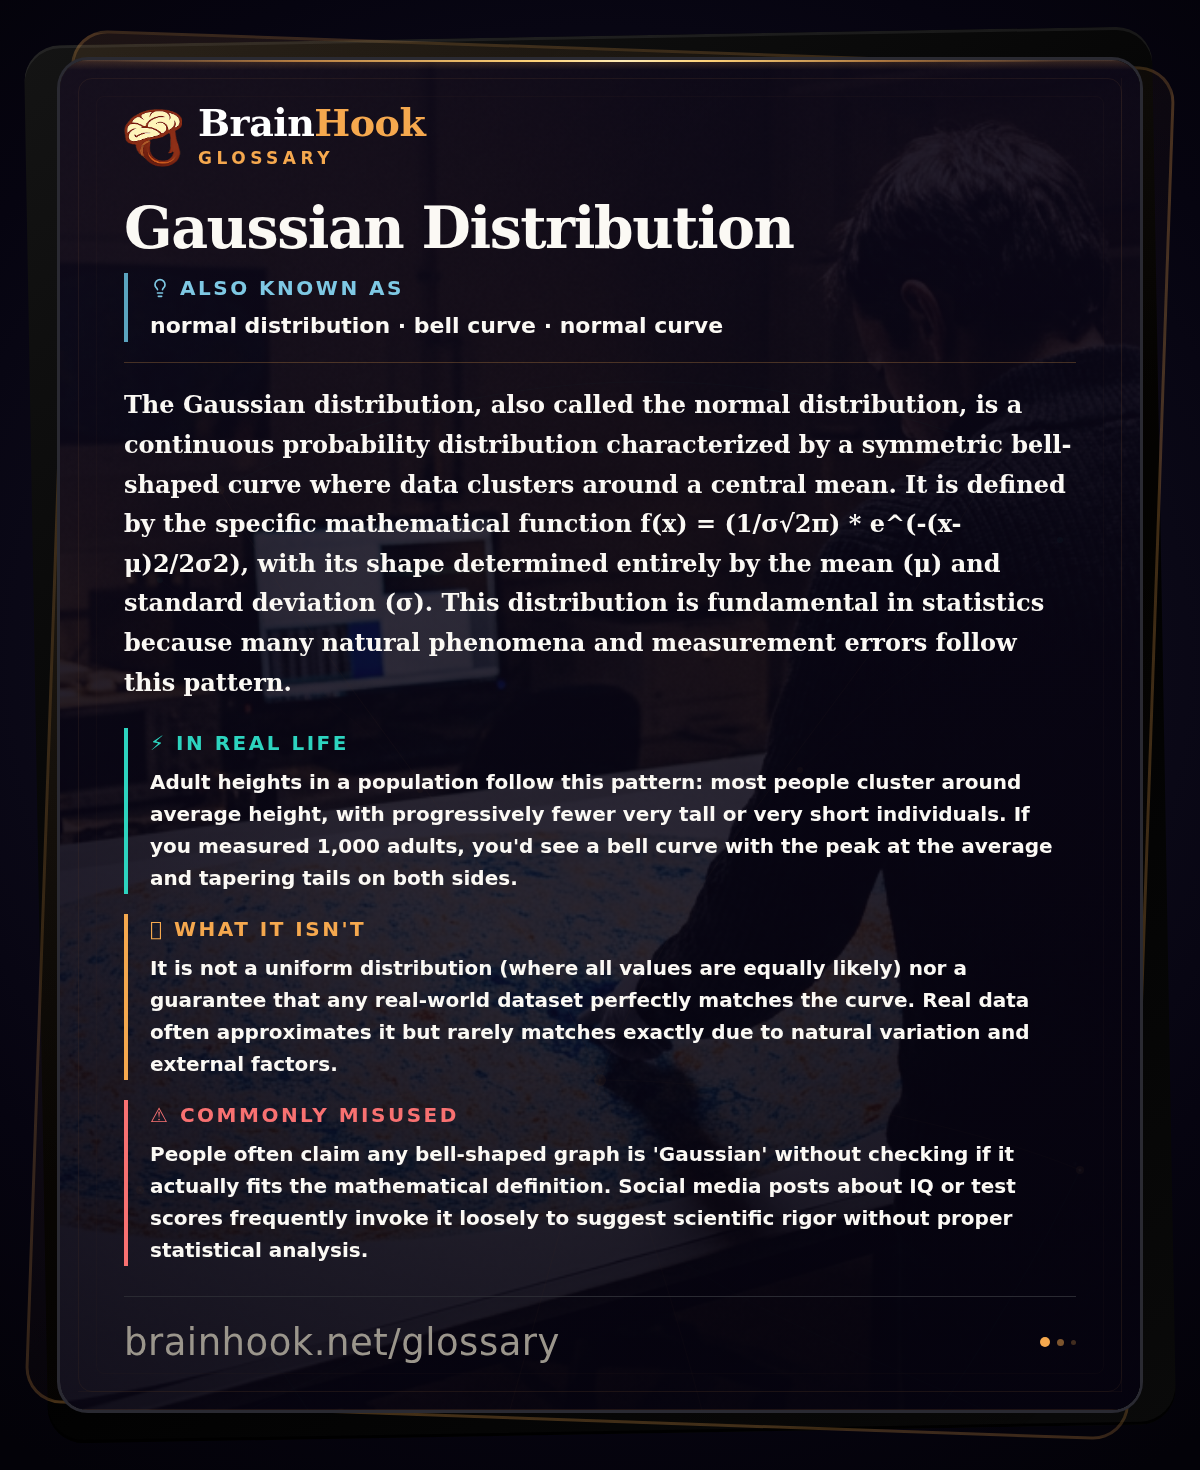
The Gaussian distribution, also called the normal distribution, is a continuous probability distribution characterized by a symmetric bell-shaped curve where data clusters around a central mean. It is defined by the specific mathematical function f(x) = (1/σ√2π) * e^(-(x-μ)2/2σ2), with its shape determined entirely by the mean (μ) and standard deviation (σ). This distribution is fundamental in statistics because many natural phenomena and measurement errors follow this pattern.
What this means in real life
Adult heights in a population follow this pattern: most people cluster around average height, with progressively fewer very tall or very short individuals. If you measured 1,000 adults, you'd see a bell curve with the peak at the average and tapering tails on both sides.
What it isn’t
It is not a uniform distribution (where all values are equally likely) nor a guarantee that any real-world dataset perfectly matches the curve. Real data often approximates it but rarely matches exactly due to natural variation and external factors.
Commonly misused online
People often claim any bell-shaped graph is 'Gaussian' without checking if it actually fits the mathematical definition. Social media posts about IQ or test scores frequently invoke it loosely to suggest scientific rigor without proper statistical analysis.